
BEYOND DASHBOARDS
A STRATEGIC ANALYSIS OF LEADING BI TOOLS
In today's data-driven world, organizations rely heavily on Business Intelligence (BI) tools to transform data into insights to make critical, real-time decisions. BI tools are used to prepare and analyze large amounts of data and present the results in tailored and user-friendly formats such as dashboards, reports, diagrams, charts, plots, and graphs.
Purchasing the correct BI tool is an extremely important decision. At Hylaine, we often witness organizations with BI tool replacement expenditures stemming from the original BI tool not meeting its full, promised objectives. BI tools are often discarded merely months after implementation due to larger volumes of data presenting unforeseen technical challenges and, more specifically, due to the following:
Organizations are often overwhelmed by the number of BI applications on the market and face challenges uncovering the true and most relevant pros and cons of each tool.
Organizations are consistently bombarded with flashy vendor demos that force users to view tools with rose-colored glasses due to the use of static and optimally prepared data and pre-developed visualizations.
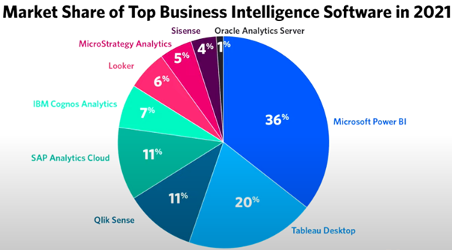
This whitepaper will help remove unnecessary noise and break down the BI tool purchasing process into the most important factors. Today, we will compare five of the most popular BI tools:
Power BI (36% of the market share)
Tableau (20% of the market share)
QlikView/Qlik Sense (11% of the market share)
Google Looker/Looker Studio (6% of the market share)
AWS QuickSight (1% of the market share)
These five tools were selected due to their respective parent company’s ecosystem’s popularity or due to their market share, according to a 2021 study by Trust Radius, as depicted right.
We will compare each tool's pricing, data connectivity, performance, ease of use, collaboration, data governance, security, machine learning, and data extraction capabilities. Our goal is to provide the necessary information for you to make a more informed purchasing decision aligning with your organization's unique requirements.
Pricing:
In this section, we will delve into the pricing structures of each BI tool, including their licensing models, subscription plans, and any additional or hidden costs to consider. Understanding the pricing component will help you evaluate the short- and long-term financial implications and identify the most cost-effective solution for your organization. Note that the prices listed below are current as of November 2023.
Microsoft Power BI:
Free License does not allow content sharing.
Pro ($9.99/user/month) License: can only share content with other Pro users, each Dataset is limited to 1GB, and each tenant is limited to 10 GB.
Premium Per User ($19.99/user/month) License: can only share content with other Premium Per User licensed users.
Premium Capacity Licenses start at $4995 monthly and can share content with any free or paid license user.
For Premium Per User and Premium Capacity Licenses, each Workspace is limited to 10 GB, and each tenant is limited to 10 TB.
Note: Premium pricing tiers can become unavoidable as in-memory data models grow.
Tableau:
Creator license: $70/user/month (cloud version), $35/user/month (on-premises)
Explorer license: $42/ user/month (cloud version), $20/user/month (on-premises)
Viewer license: $15/user/month (cloud version), $10/user/month (on-premises)
Tableau differentiates self-service users via the Explorer License (limited to content creation) from data developers via the Creator License.
QlikView / Qlik Sense:
Qlik has separate pricing tiers for QlikView and Qlik Sense. Of the two, QlikView is the more robust product for BI developers.
Qlik Sense: Dedicated Server fees start at $1500, and user licenses start at $30 per month.
QlikView Pricing:
Personal Edition (individual use only) – Free
Named User License – $1,395 for per-seat licenses.
Document License – $360 per named user, per application.
Concurrent License – $15,495 for floating licenses.
Small Business Edition Server license: $8,400 per server for up to 25 Named User licenses and 100 Document licenses.
Enterprise Edition Server (no license limitations) – $36,150 per server.
QlikView also charges $20,000 for QlikView Publisher, PDF Report Distribution, and SAP NetWeaver Connectors.
Google Looker:
Creator license: $70/user/month (cloud version), $35/user/month (on-premises)
There are separate pricing tiers for Looker and Looker Studio (formerly known as Google Studio). Of the two, Looker is the more robust product for BI developers.
Looker Standard: 10 Standard users, $550 per user/month
Looker Advanced: Standard Looker + 100k Query API Calls, $1100 per user/month
Looker Elite: Advanced + 100k Admin API Calls, $1650 per user/month
Looker Studio Single connector: one data source, $49 per month
Looker Studio Essential: up to 9 data sources, $119 per month
Looker Studio Core: up to 24 data sources, $119 per month
Looker Studio Super: up to 45 data sources, $579 per month
AWS QuickSight:
Pay-per-session viewer pricing starts at $0.30 per session, maxing out at $5 per user per month.
Developer licenses start at $18 per month.
QuickSight’s pricing structure benefits Organizations with more users than developers.
There are additional capacity fees for in-memory storage; due to Direct Query performance, in-memory storage is often unavoidable. Thus, similar to Power BI, hidden prices can increase as data models grow.
Special Note: For the parent companies of Microsoft, Google, and AWS, as well as Salesforce for Tableau, it is recommended to first check with your vendor representative if your current licenses include discounted or free BI tool licenses (for example, Power BI Pro is included for free with Microsoft Office 365 E5).
Data connectivity:
In this section, we will examine the data connectivity capabilities offered by each tool, exploring their flexibility and compatibility with different data sources and file formats. Evaluating data connectivity capabilities is crucial to helping ensure turnkey integration with existing and future infrastructures.
Power BI: Supports 214 standard connections.
Tableau: Supports 93 standard connectors.
Looker: Supports over 800 data sources.
QlikView: Supports 50+ databases.
AWS QuickSight: Supports 20 relational data connectors but supports a limited number of non-AWS cloud data sources.
Note: However, all tools can connect to any database source using ODBC, JDBC, and/or OData connections.
Performance and scalability:
In this section, we will assess the performance metrics of each BI tool while considering factors such as scalability, query and visualization speed, data processing capabilities, and known performance limitations. Performance capabilities are key to gauging how efficiently a tool can handle current data volumes and the tool’s ability to scale to meet future demand.
All five tools support the following:
Incremental loads
In-memory storage
Database Direct Querying
Blending of secondary data sources
However, applying filters on Tableau's secondary blended sources can lead to extremely slow performance and restricted Level of Detail (LOD) expression usage.
AWS QuickSight leverages a scalable serverless cloud-native platform.
Using in-memory storage, Looker’s Google Data Extract connector can store up to 100 MB of data, and QuickSight can store up to 500 million rows.
Power BI enforces data restrictions for both in-memory storage (up to 1GB, Pro, and 10GB data, Premium) and Direct Query connections (up to 4 MB on-premises and 1 million rows for cloud).
Public benchmarks have highlighted Power BI’s slow performance while handling bulk data.
Per public benchmarks, QlikView performs comparatively well when processing over 1 million records using in-memory storage since calculations happen at the database level without drawing down RAM.
Per public benchmarks, Tableau's cubing (MDX) technique occasionally produces slower query performance than all four other engines.
Public benchmarks have shown that Tableau visualizations scale substantially better than QuickSight with large data volumes.
Three of the tools are optimized for their parent company’s ecosystem:
Power BI performs optimally on Microsoft SSAS Tabular and Analysis Services databases utilizing Vertipaq for column-store storage.
QuickSight’s Direct Query to AWS Athena is highly optimized since both services leverage a serverless architecture.
Using the Google BigQuery connector, Looker can process up to 35 billion rows in 10 seconds.
Ease of use:
In this section, we will explore the intuitiveness and user-friendliness of each tool’s front-end and back-end interfaces. We will also analyze the ease of preparing data and creating visualizations. This section will help you assess your teams’ ability to quickly adapt to and maximize a tool's full potential.
Power BI: Visualizations are easy to build with numerous visualization types. Both DAX, due to strong data typing, and M Query, due to case sensitivity, present a steeper learning curve than other programming languages. Additionally, limited DAX functions are available while leveraging Direct Query connections.
Tableau: Steeper visualization learning curve but offers the most powerful visualization capabilities. Tableau has the most advanced GIS capabilities.
Looker: Uses a code-based approach requiring prior SQL knowledge.
Qlik: Often requires more clicks for specific tasks than other BI tools.
AWS QuickSight: Relatively easy to use but offers fewer visualizations than other tools; for example, QuickSight doesn’t include Gantt chart visualizations. Filters are less intuitive and often require the use of global parameters.
Collaboration:
In this section, we will compare the collaboration features offered by each tool, such as the ability to collaborate on analyses in real-time and to distribute and facilitate data-driven development and decision-making across teams. Tools with superior collaboration capabilities help foster a culture of teamwork and knowledge-sharing within your organization.
QlikView's collaboration features are slightly less robust than Power BI and Tableau.
QuickSight focuses on sharing interactive Dashboards within the AWS ecosystem.
Looker's real-time collaboration capabilities are the most robust of all five tools.
Data Governance:
In this section, we will consider the data governance capabilities of each tool, including data cataloging and data lineage. The data governance components of a BI tool are critical for maintaining compliance and data accuracy throughout your organization.
Looker is the only tool with an Explore page for developers to search for back-end terms and the only tool with an embedded Data Dictionary.
All five tools support data lineage and data and report cataloging. However, cataloging in Power BI requires custom development, and lineage in QuickSight requires custom development.
Unlike the other three tools, Power BI and Qlik lack nested workspaces, limiting capabilities to model security to Org Charts without proliferating workspaces.
While all tools support data quality monitoring and alerting, Tableau and Qlik offer the most intuitive standard solutions.
Security:
In this section, we will delve into the security measures and controls implemented by each BI tool, including data encryption and data access restrictions. The security features of an application help maintain data privacy and safeguard sensitive data.
All five tools offer well-rounded sets of security features, including data encryption and Data Loss Prevention classification.
Power BI, Looker, and AWS QuickSight benefit from the robust security frameworks of their respective parent companies.
While all tools support row-level security, only Qlik can provide table-level security. And only Qlik and QuickSight can provide column-level security.
Only Looker supports multi-factor authentication.
Machine learning:
In this section, we will analyze the machine learning capabilities supported by each BI tool by examining their ability to predict trends, uncover patterns, and facilitate self-service analysis. By leveraging those capabilities, you can gain deeper and quicker insights from your data.
All five tools support Python. However, only QuickSight does not natively support R.
Looker can integrate with OpenAI. Qlik allows users to create a Chatbot. And Tableau has built its own Tableau GPT engine.
QuickSight can leverage machine learning to identify data anomalies and make predictions.
All tools besides Looker support Natural Language Processing with Q&A functionality on the Dashboard canvas.
Power BI, QuickSight, and Tableau can all auto-summarize data through “smart narratives” features.
Data export:
In this section, we will assess each tool’s capabilities and limitations in dumping data into various formats. An organization will need to ensure that its BI tool can extract data properly to support downstream analysis and applications.
All five tools allow users to export data in a variety of formats, including either CSV or Excel format.
Qlik Sense can export up to 750,000 rows but cannot export data from the Trellis Container visualization.
AWS QuickSight exports up to a lower of 1 million rows or 500 MB of data and only up to 40 columns.
Power BI has a limit of 150K rows for Excel extracts without using Paginated Reports or Low Code Power Platform applications.
Tableau supports up to 16,384 columns, 1,048,576 rows, and 33,554,432 cells for crosstab Excel download.
Looker’s scheduled emails are limited to 20 MB of inline content or 15 MB of attachment data.
Conclusion:
BI tools should align with business objectives and provide long-term value throughout your organization. There are many factors to consider when purchasing the correct tool. Hopefully, this whitepaper was able to shine a light on the key considerations when evaluating these five popular tools. Listed in the figure below is a summary of these considerations and the strengths and weaknesses of these five common tools.
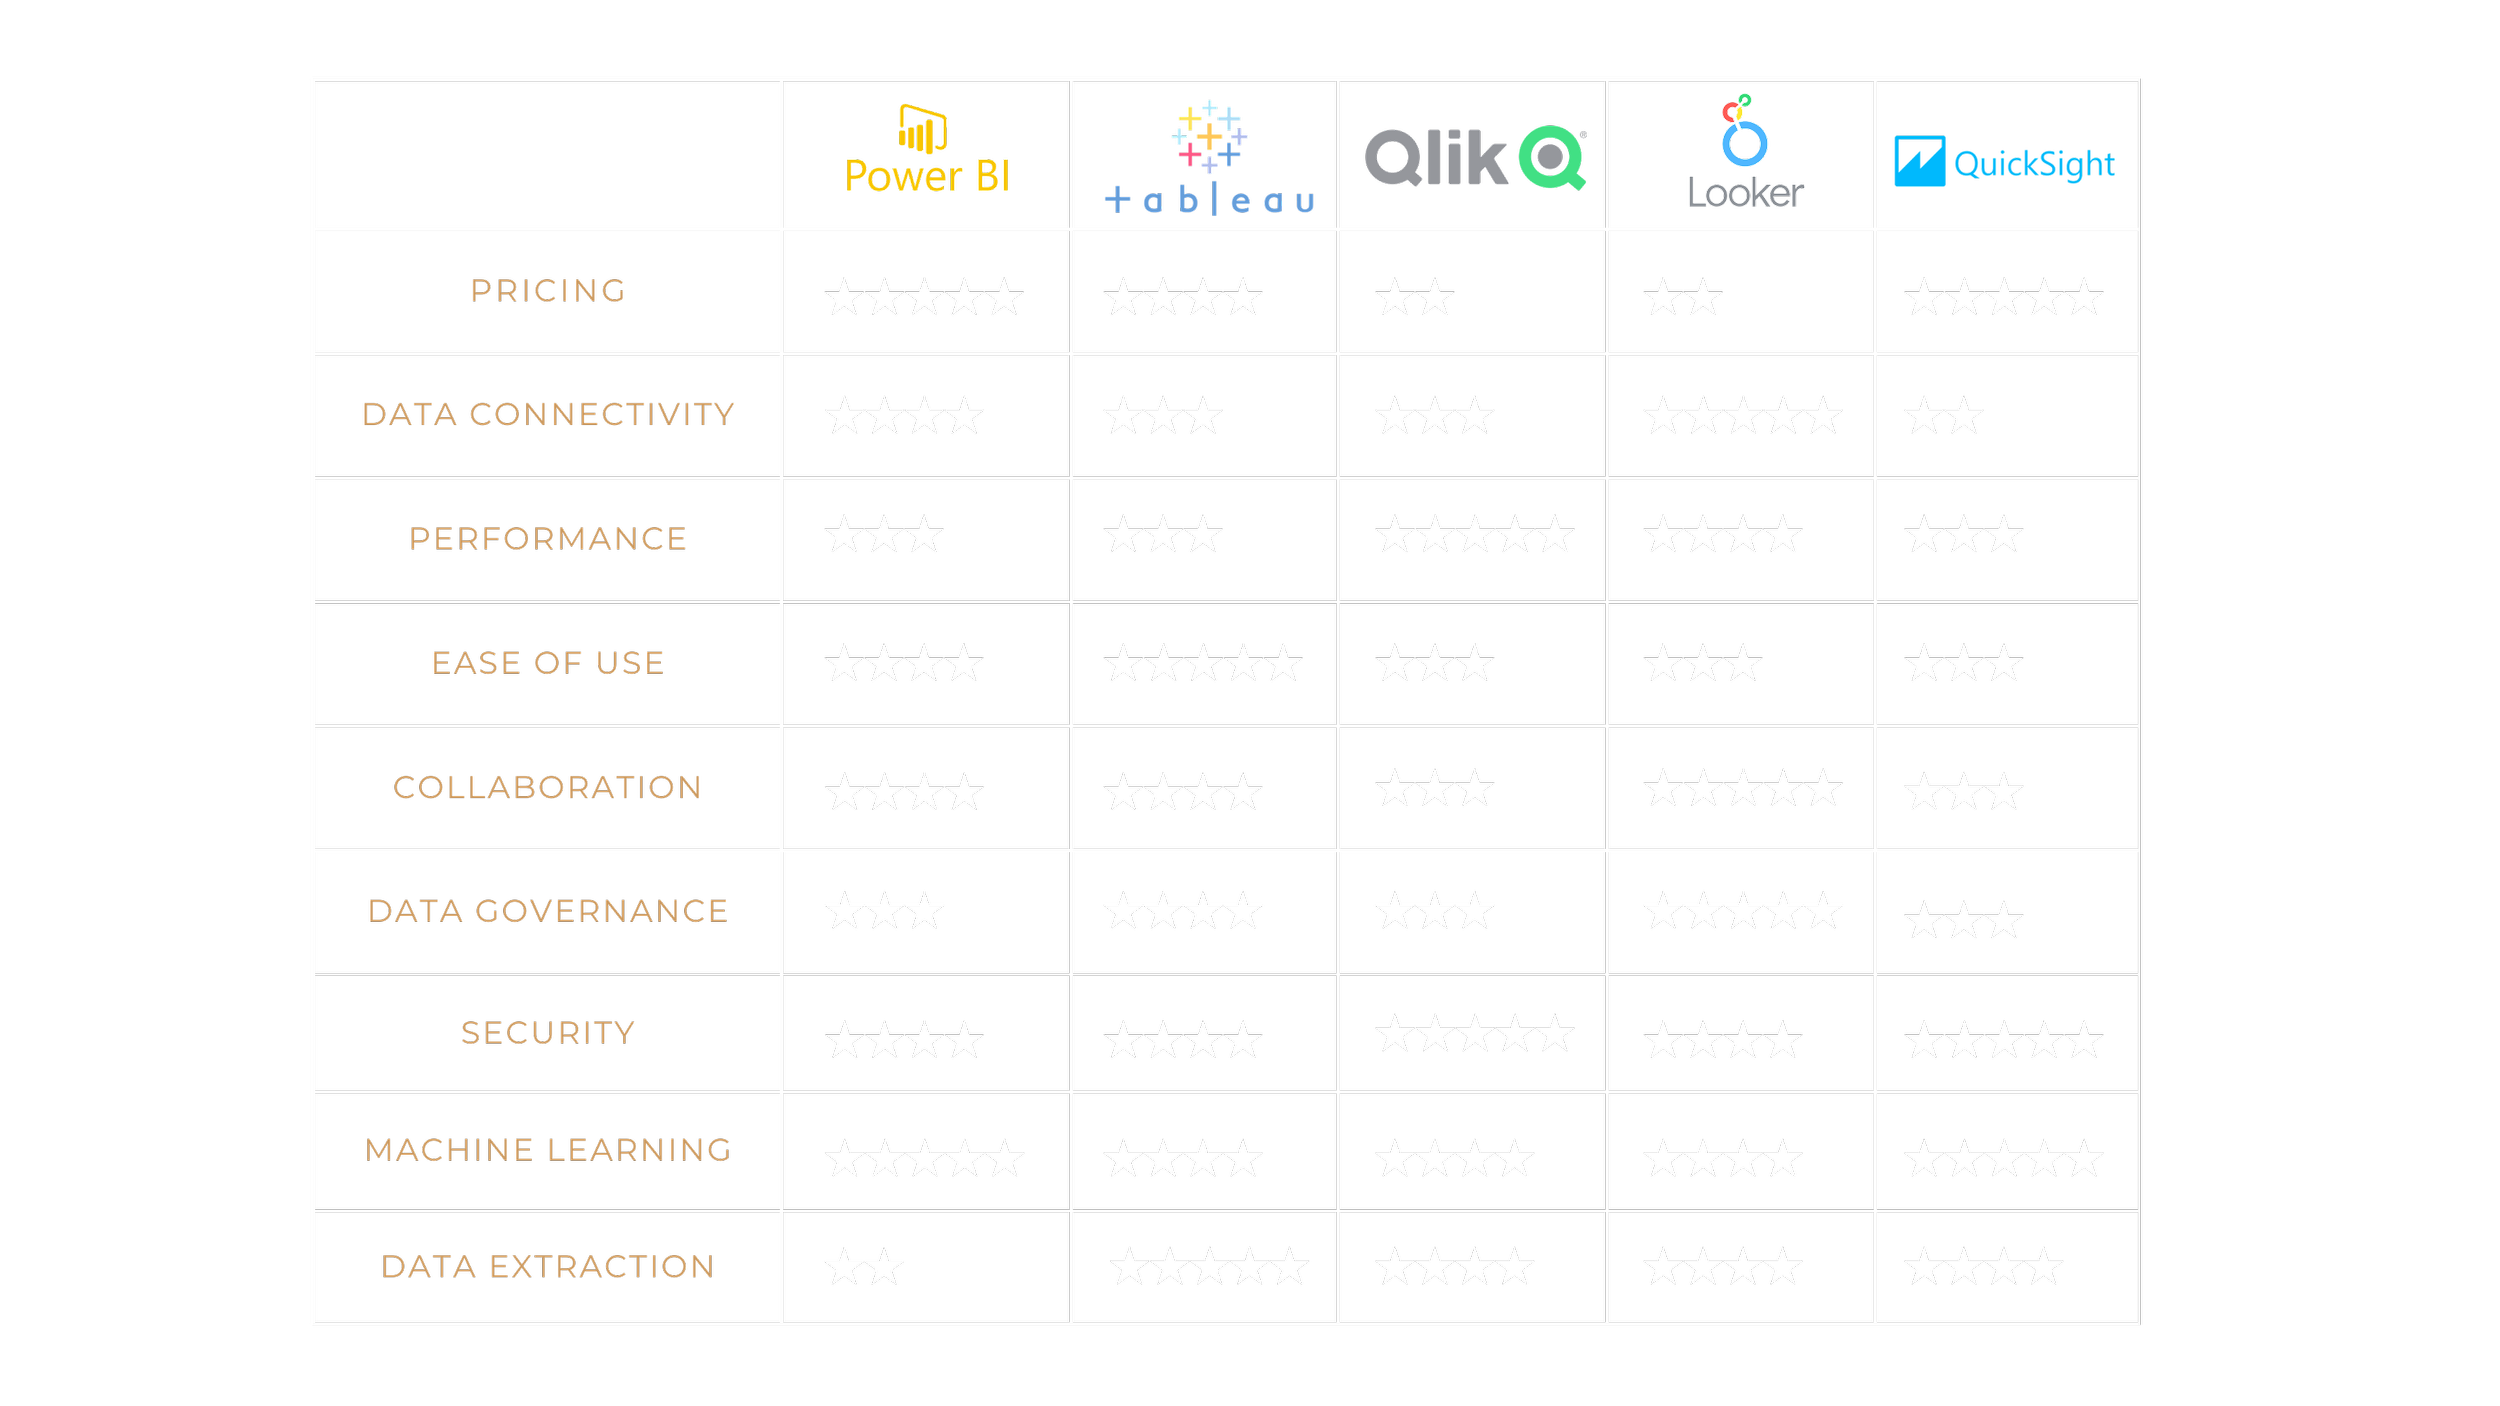
Figure 1: The weighted scores of these five tools across the nine categories discussed in this whitepaper. Note that ***** is the highest rating and * is the lowest rating
Ultimately, the optimal BI tool for a particular organization will depend on specific needs and budget requirements. This includes the industry, size, and complexity of a business. Furthermore, some organizations might require real-time reporting or advanced analytics capabilities, while others may prioritize data visualization or performance and scalability. By understanding specific needs, organizations can narrow down their choices and find a BI tool that aligns with their goals. For example:
For those organizations with a specific ecosystem, Hylaine recommends sticking with the respective BI application:
QuickSight within an AWS cloud ecosystem
Power BI within a Microsoft cloud or on-premises ecosystem
Looker within a Google cloud ecosystem.
If you are looking for the gold standard of visualizations with less concern about data blending – Tableau wins.
If you are looking for a platform-agnostic scalable tool for Organizations with larger budgets – Qlik wins.
While this whitepaper may have provided some foundational analysis and considerations, Hylaine recommends that organizations perform proper due diligence to ensure full business alignment. For additional details and to maximize application ROI, an experienced consulting firm like Hylaine can help guide an organization through.